Hivesignal
Hivesignal is a package designed for signal analysis and manipulation. A signal can come in multiple forms, from music, to electricity. Hivesignal includes methods to make working with this type of data much easier and less of a pain. It also includes methods to analyse, decompose and transform those signals as needed.
IO
COMTRADE
This type of file is defined by the IEEE to store data from oscilographic material. The types of files it includes may vary, but the two main files we will be reading are the .cfg and the .dat files. This will return all analog, digital and extra information from the electric substation. For more information about the transient data exchange protocol, check the IEEE docs here: https://ieeexplore.ieee.org/document/156995.

Transformations
Fourier Transform (FFT)
The fourier transform is a decomposition technique, to transform a signal with a magnitude (current/voltage/decibels) over-time to a series of frequencies and magnitudes. This points can be then transform into a series of sinusoidal waves that approximate the original wave.

The fourier transform can give you a good idea of what the frequencies are, but WILL NOT tell you when those frequencies happen. For that, it is recommended to check out the Wavelet Transform instead, giving a bit of both spectrums at a time.
It is recommended to not use the fourier transform in every case as it may result in unexpected results. Make sure that leaving the time spectrum behind is going to make your life actually easier.
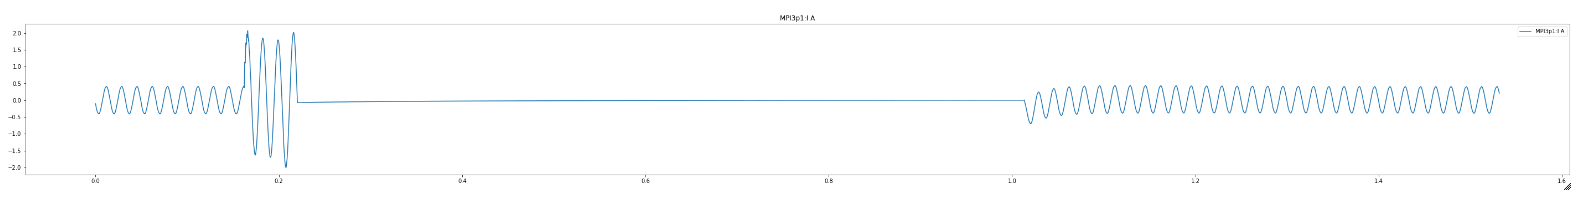
Example FFT
An example of the Fourier Transform can be seen while detecting lightning strikes. Let’s suppose you want to detect if an analog signal has residual frequencies from an atmospheric event, you could do this by asking yourself about the normal frequencies that are in that cable and if the atmospheric event changes them. The answer for those questions in this case are both yes. A normal frequency in an electric net is around 50Hz to 60Hz. After knowing this, we might add a small error of around 1HZ to both sides to include reading errors.
As for the atmospheric event, it does in fact change the frequencies of the reading in both low frequencies and high frequencies. The low frequencies come from the release of energy from the plasma, while the high frequencies come from a direct hit by the lightning. In this case, we could find the Area Under the Curve (AUC) of all the frequencies and compare that to the abnormal AUC. This will give us a percentage of how abnormal the spectrum was. This analysis is called Normal AUC Analysis (NAUCA) and is included in the library.

In this case, a 0 NAUCA will indicate there was no abnormal frequencies, while a NAUCA near 1 will indicate a high chance of an event.